The Fishbone Diagram, also known as the Ishikawa Diagram or Cause-and-Effect Diagram, is a visual tool used for identifying the root causes of a problem. It helps teams analyze and organize potential causes into categories, making it easier to identify and address the primary source of an issue.
Structure of a Fishbone Diagram
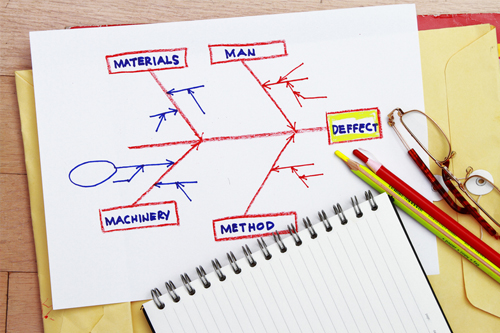
The diagram resembles a fish skeleton, where:
- The "head" represents the problem statement (effect).
- The "bones" represent major cause categories.
- Sub-branches contain potential root causes under each category.
Benefits of Fishbone Diagram
- Identifies root causes systematically – Helps prevent recurrence.
- Enhances teamwork & brainstorming – Encourages collaborative problem-solving.
- Improves decision-making – Provides a structured approach to solving complex issues.
- Integrates with Lean, Six Sigma, and Total Quality Management (TQM).
By using the Fishbone Diagram, organizations can eliminate defects, reduce waste, and improve efficiency for sustainable growth

